
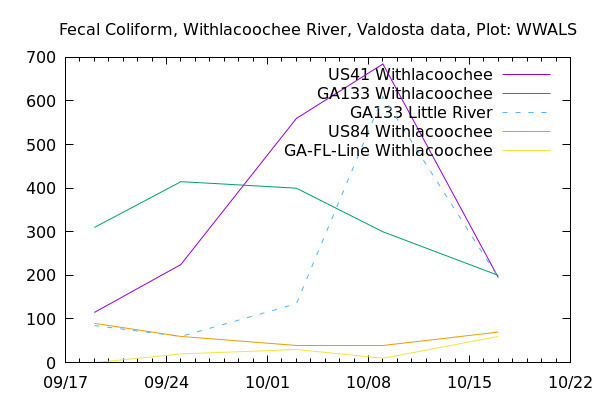
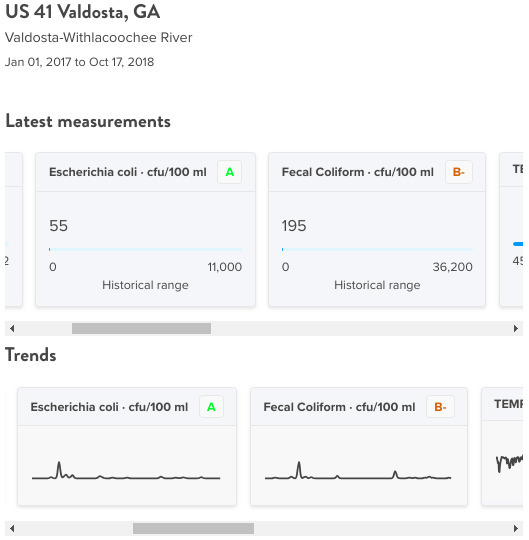
Fecal coliform went down last week to 195 at US 41 and 200 at GA 133 on the Withlacoochee River, right at the Georgia limit of 200 cfu/100 ml, while rising slightly at US 41 and at the GA-FL line at the Madison Highway Horn Ferry Bridge, according to Valdosta’s testing.
Wednesday of this week, we still don’t know, because the open records request we filed for that hasn’t come back yet. We are still negotiating with Valdosta about how to get their Wednesday data before the weekend. WWALS also now has assembled a testing kit, and we will do some measurements this coming week. No matter who is doing the bacterial testing for E. coli or Fecal coliform, the closest you can get to the present time is about 18 hours, because that’s how long it takes to incubate the samples. And of course any such test is advisory, since the actual amount of bacteria in the water can fluctuate rapidly, and the effects on any individual will vary depending on many factors. Nonetheless, we hope soon at least to be able to post advisories.
Preparing for the WWALS Boomerang paddle race next Saturday, November 3, 2018, we’re especially interested in US 41, North Valdosta Road, just upstream from the race start at Langdale Park Boat Ramp. So it’s good to see that Wednesday of last week both Fecal coliform and E. coli were below the state limits of 200 cfu/100 ml for each.
But why are we seeing these wild swings in bacterial levels? Maybe it has to do with rainfall, maybe washing something into the river.
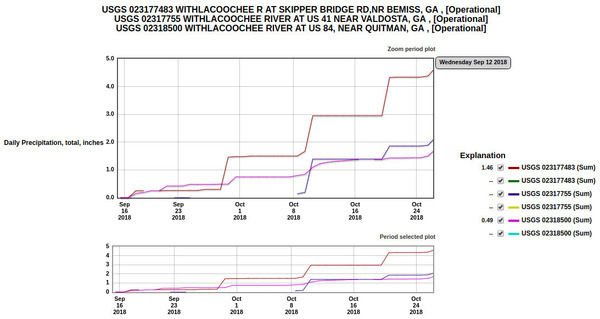
There was rain upstream at Skipper Bridge Sept. 29 and downstream at US 84 Sept. 30, but not at US 41. Maybe that’s related to FCOLI going up at US 41 on Oct. 3.
Rain fell all three places Oct. 9 and 10, but that was probably mostly after the samples were taken on October 9, when the peak shows for Fecal coliform at US 41.
After the water quality data we have so far, rain fell again Oct. 19 and 20 at Skipper Bridge and US 41, but not at US 84.
Finally, rain fell again at all three gauges Oct. 25.
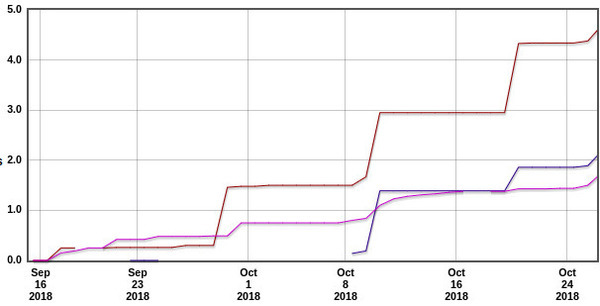
Well, what about water levels, shown as gauge height?
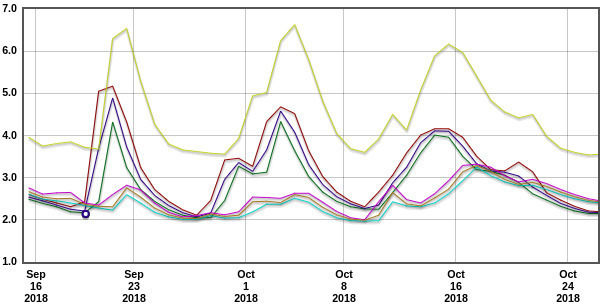
The USGS water level graph shows the gauges out of order, with US 41 having the highest peaks, then Skipper Bridge, then US 41.
Skipper Bridge peaked Oct. 3, about four or five days after the Sept. 29 and 30 rain, followed by US 41 a day later and US 84 a day after that. So water was high at US 41 when FCOLI went up on Oct. 3.
Again, on Oct. 15 Skipper Bridge peaked about four or five days after the Oct. 9 and 10 rain, followed by US 41 and US 84 a day later and a day after that. Which leaves the Oct. 9 FCOLI peak at one of the lowest levels of the river at all three gauges. However, the high water level at US 41 on October 16th might have washed away the Fecal coliform, leading to the lower bacteria levels measured.
After the testing data we have so far, not much gauge height effect is seen after the Oct. 19 and 20 rains.
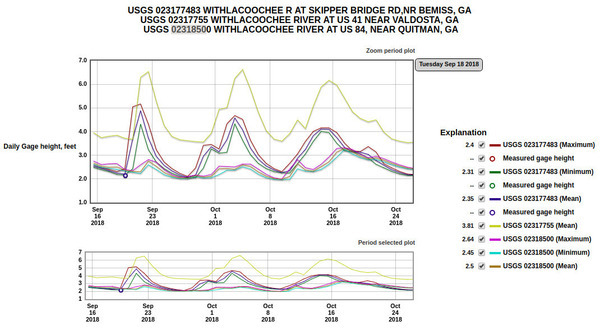
If there is some correlation between Fecal coliform and rainfall or river water levels, it is not entirely obvious. Maybe comparing over longer timespans will start to reveal something.
We also have data from Valdosta for the Alapaha River Basin.
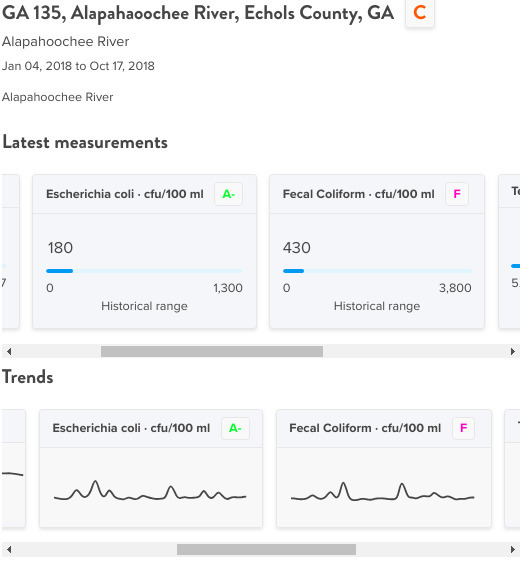
Fecal coliform went down last week at Johnson Road on Mud Creek, but it went up at the Alapahoochee River near the state line.
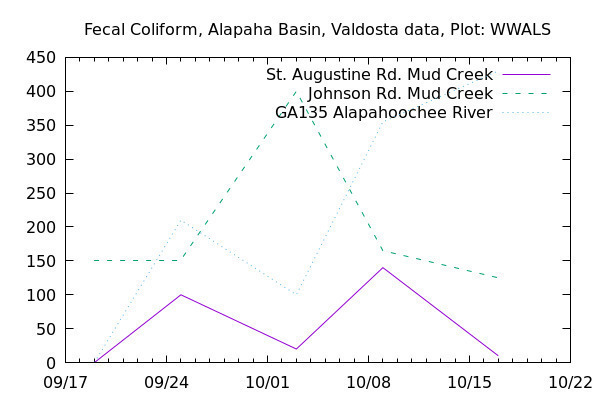
430 cfu/100 ml is more than twice the state limit for Fecal coliform. It’s also higher than the previous week at Johnson Road, so it seems more likely that something is getting into the water in between than that it is just washing downstream.
All this shows once again that point source spills from wastewater treatment plants are far from the only sources of bacterial contamination in our waters. According to GA-EPD in Atlanta, there were no spills reported recently. Well, up to a dozen days ago.
Maybe your organization would like to sign up to help ask GA-EPD to tell us every day if any spills have been reported to Atlanta?
Yet E. coli and Fecal coliform are showing up. Where are they coming from?
-jsq, John S. Quarterman, Suwannee RIVERKEEPER®
You can join this fun and work by becoming a WWALS member today!
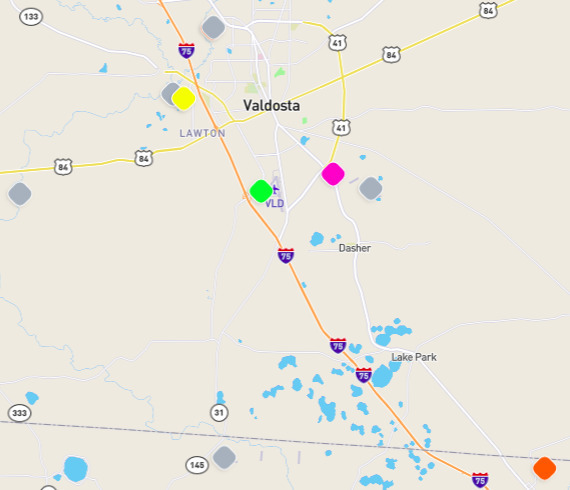
Map in Water Reporter
Here is the map of this data in Water Reporter. Click on one of the diamond shapes to see graphs.
Short Link: