
This is why we alway say “as near as we can tell” or “according to the latest data” or words to that effect. The last data we had last week said fecal coliform at GA 133 on the Little River was below the state limit. But the actual most recent data, from last Tuesday, just received today, shows 610, which is three times the state limit of 200 cfu per 100 mililiters.
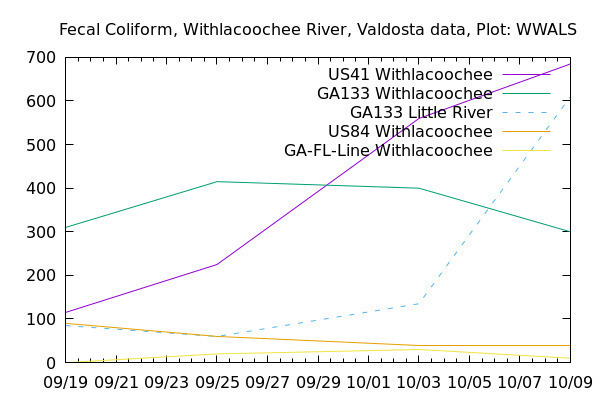
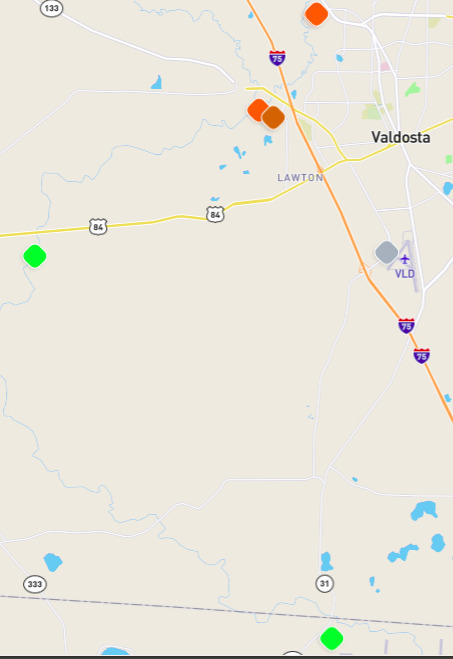
Meanwhile, on the Withlacoochee River, the count went up at US 41 and down at GA 133, with both still well above the state limit. But downstream of Valdosta and its Withlacoochee Wastewater Treatment Plant (WTP), at US 84 and at Horn Bridge at the GA-FL line, counts that were already within the limit went down. The above graph plots four weeks of Valdosta data, for September 19 and 25, and October 3 and 9, 2018.
As I wrote last week, “It will be even more encouraging if we can find a way to get a given Wednesday’s data before the weekend.” And I have filed an open records request for yesterday’s Valdosta data.
But of course things could change from a Wednesday to a Saturday. And you can’t really get closer than about 18 hours to now, because that’s about how long it takes to process bacterial data.
WWALS nas an initial water quality test kit assembled, and we will be doing our own testing. Soon we hope to start posting advisories on Swim Guide.
But any water quality test data is only advisory. The actual quality of the water could be better or worse. And health reactions to water of any quality vary from person to person.
So was the water safe when we cleaned up last Saturday on the Little River starting at Troupville Boat Ramp, down around the Confluence, and back up the Withlacoochee River? We don’t know, and we can’t know. But a more recent indicator was not as good as the indicator we had seen.
With WWALS also testing, maybe we can find out where this contamination is coming from, and maybe there’s something that can be done to stop it.
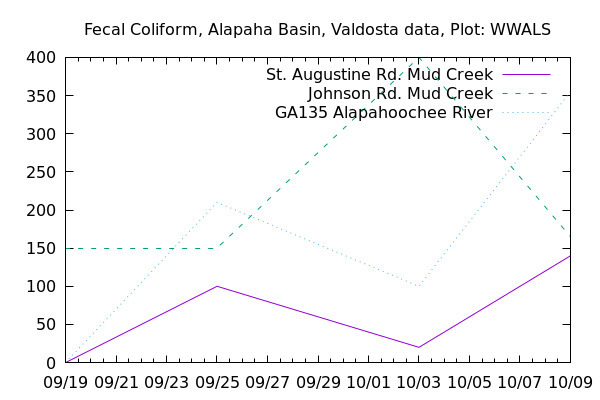
Graph, Alapaha Basin
The Alapaha River Basin situation was equally counter-intuitive. Fecal coliform went up above Valdosta’s Mud Creek WTP, at St. Augustine Road (though still within the state limit) and below, at GA 135 on the Alapahoochee River (well over the state limit). But it went down just below that WTP, at Johson Road, back down within the limit.
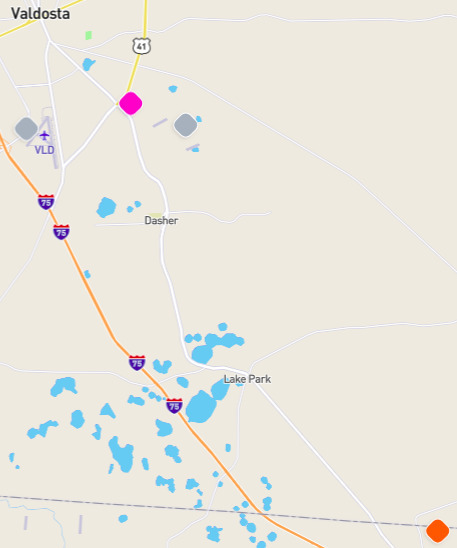
Stations, Alapaha Basin
Water Reporter Map
All the data Valdosta has sent is in this Water Reporter map, which includes every Wednesday of 2018 through October 3rd plus Tuesday, October 9th.
-jsq, John S. Quarterman, Suwannee RIVERKEEPER®
You can join this fun and work by becoming a WWALS member today!
Short Link: