
Here is Lowndes County’s (not Valdosta’s) stream monitoring data for a year after its September 23, 2017 raw sewage spill into a ditch that goes to the Withlacoochee River. The data show often worse water quality upstream than downstream. This is a good illustration of why WWALS is starting a water quality testing program.
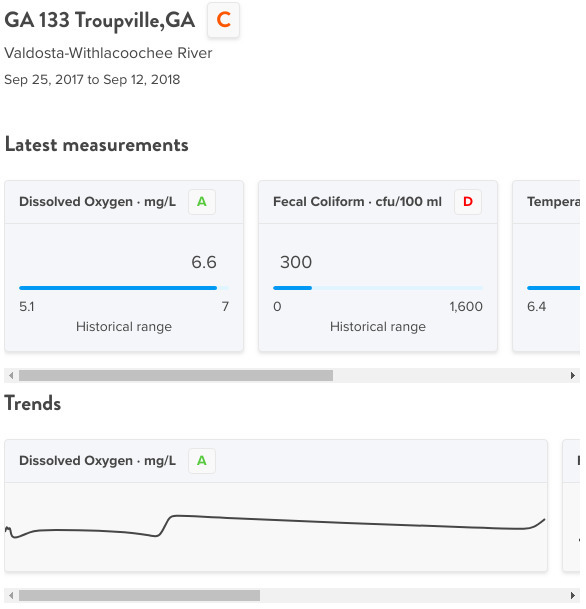
Graphs, Below at GA 133
These graphs are in Water Reporter, where I put the data under the Suwannee Riverkeeper group. The first two graphs are from below the spill, downstream on the Withlacoochee River at GA 133 (St. Augustine Road).
Fecal Coliform, Below at GA 133
The other graphs show nothing unusual for blackwater tannic acid rivers. This is the interesting graph, since it shows measurements of bacteria that can cause disease.
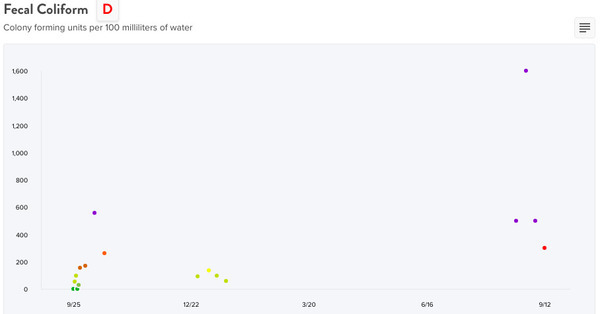
As you can see, fecal coliform was not high immediately after the spill. It did climb a week later, but it was even higher a year later.
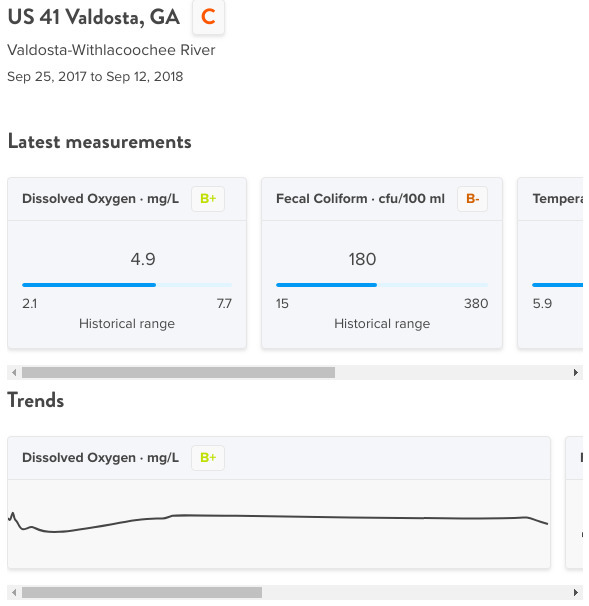
Graphs, Above at US 41
You might expect worse bacterial contamination upstream from the spill, but it ain’t necesarily so. These graphs show data from US 41 (North Valdosta Road), above (upstream) of the spill.
Fecal Coliform, Above at US 41
The fecal coliform counts go higher faster above than below the spill. And, like below, they climb again above a year later, even higher than below. Plus the highest data point is in the winter. It would be very hard to attribute those September 2018 or December 2017 high fecal coliform counts to a spill downstream in September 2017.
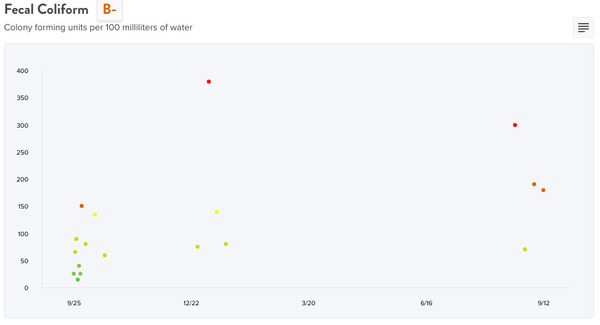
It’s also quite difficult to attribute these counts to anything coming from Valdosta, since the US 41 bridge is upstream from Valdosta’s Withlacoochee Wastewater Treatment Plant, and upstream from Sugar Creek.
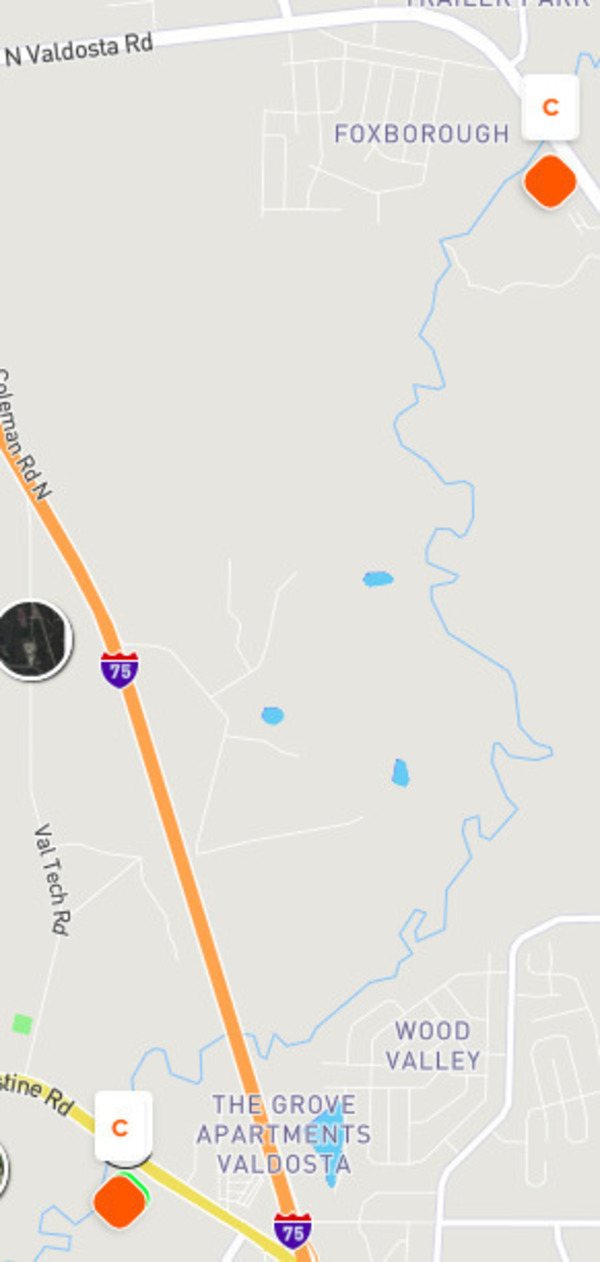
Spill-data-locations, Map
The spill location is shown on the Water Reporter map on Val-Tech Road near I-75, and the above and below testing locations are marked with the orange blobs and the letter C grades at US 41 and GA 133.
Last week I thanked Lowndes County Utilities Director Steve Stalvey for sending WWALS information about all their spills since Hurricane Irma, and thanked him in advance for sending the NPDES-permit-required followup water quality testing data; see LAKE video.

The only one of those spills with more than 10,000 gallons was the September 2017 spill. It turns out there’s a reason he didn’t give me the testing data for that one lat week: it hadn’t been quite a year since the spill, so Lowndes County hadn’t sent it to the Georgia Environmental Protection Division (GA-EPD). The other day I got that STREAM MONITORING REPORT FORM FOR A MAJOR SPILL from GA-EPD through a Georgia Open Records Act (GORA) request.
We also got much other data about the whole state from GA-EPD; you will see that soon.
And you will see more about the forming WWALS water quality testing program. We’d like to know where the contamination is coming from (sewage, septic tanks, cows, horses, deer, other?), and when, so we will be doing some testing. If you swim, fish, or boat in the Withlacoochee River, you may want to know that, too. You can help.
-jsq, John S. Quarterman, Suwannee RIVERKEEPER®
You can join this fun and work by becoming a WWALS member today!
Short Link: